Police numbers, January 1 to October 11, 2026
Bay Ridge and Dyker Heights had the lowest violent crime rate in Brooklyn this year, with 1.18 reported violent crimes per 1,000 residents, making it one of the safest neighborhoods in the city. Brooklyn as a whole sits at 3.55.
We read the police department’s own weekly report for every one of the 23 precincts, through October 11, 2026, and divided by the people who live there. All six of the lowest rates are in the southern half of the borough, and the 70th Precinct, which covers Midwood, had the steepest drop of all.
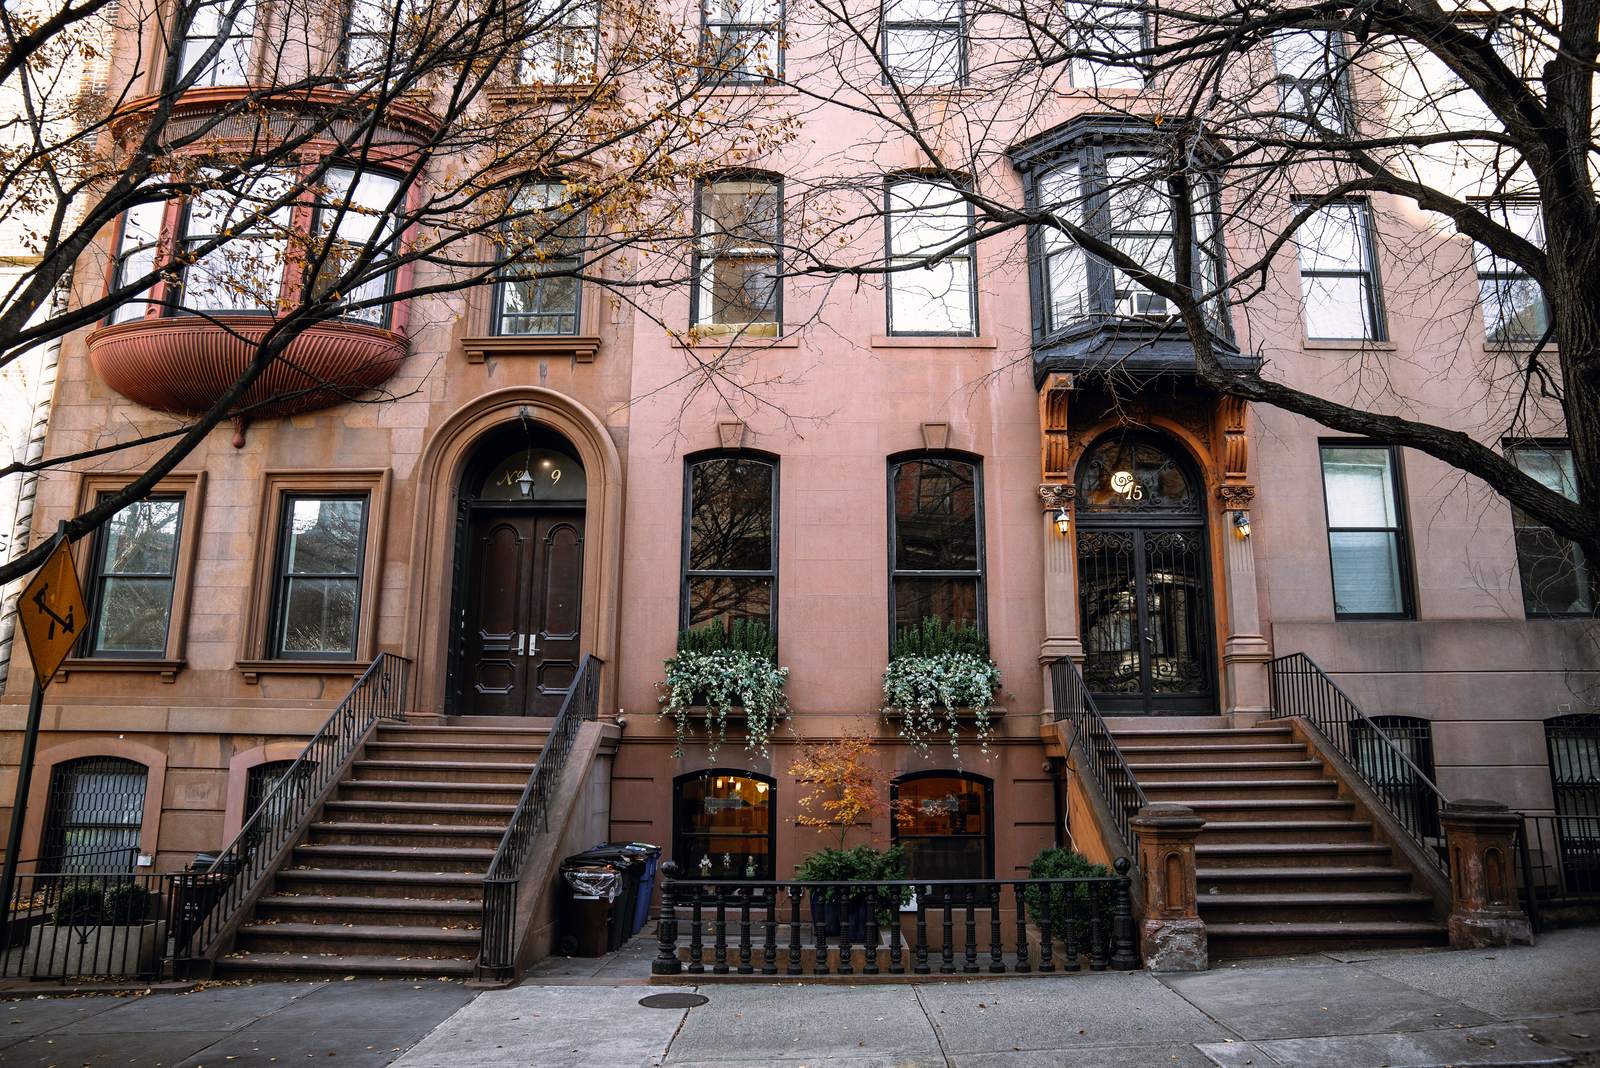
Stock photos of New York streets and parks. Photos: Charles Parker, Douglas Schneiders, Sasha Zilov, Sean Ingram, Y on Pexels.
The short version
On this page
The fairest way to compare neighborhoods like Bay Ridge and Bushwick is a rate. A big precinct will always report more crime than a small one, so we divided each precinct’s violent crimes by the number of people who live in it.
Violent crime here means the four person crimes in the police report: murder, rape, robbery and felony assault. Burglary, grand larceny and car theft count toward the total, but not toward this rate.
The 10 lowest violent crime rates in Brooklyn, 2026 so far
Reported murders, rapes, robberies and felony assaults per 1,000 residents, January 1 to October 11.
NYPD CompStat weekly precinct reports; 2020 Census population by precinct.
Every precinct in the top six sits in the south or southwest of the borough. Three of them cover the neighborhoods where we sell: the 70th for Midwood, the 61st for Madison and Sheepshead Bay, and the 63rd for Marine Park.
| Rank and area (precinct) | Violent crimes per 1,000 residents | Violent crimes, 2026 so far | Violent crime vs 2025 | All seven major crimes vs 2025 |
|---|---|---|---|---|
| 1. Bay Ridge, Dyker Heights (68) | 1.18 | 160 | -7% | -1.6% |
| 2. Borough Park, Kensington, Mapleton (66) | 1.36 | 279 | +4.5% | -4.2% |
| 3. Bensonhurst, Bath Beach, Gravesend west (62) | 1.83 | 364 | +19.7% | +0.6% |
| 4. Sheepshead Bay, Madison, Homecrest, Manhattan Beach, Gerritsen Beach (61) | 1.87 | 317 | -10.2% | -6.4% |
| 5. Marine Park, Mill Basin, Bergen Beach, Flatlands (63) | 2.17 | 245 | +12.9% | -4.9% |
| 6. Midwood, Flatbush, Ditmas Park (70) | 2.18 | 358 | -33.2% | -24.1% |
| 7. Greenpoint (94) | 2.42 | 176 | -15.8% | -15.9% |
| 8. Sunset Park, Windsor Terrace, South Slope (72) | 2.45 | 327 | -4.9% | -3.1% |
| 9. Carroll Gardens, Cobble Hill, Gowanus, Red Hook (76) | 2.68 | 128 | 0% | -4.7% |
| 10. Williamsburg (90) | 2.85 | 375 | -11.8% | -3.6% |
| 11. Park Slope (78) | 2.87 | 210 | +9.9% | -1.2% |
| 12. Fort Greene, Clinton Hill (88) | 3.77 | 243 | +1.2% | -16.4% |
| 13. Crown Heights south, Prospect Lefferts Gardens, Wingate (71) | 3.81 | 389 | -13.2% | -5.2% |
| 14. Canarsie (69) | 3.87 | 351 | +27.6% | +4.4% |
| 15. Bedford-Stuyvesant west (79) | 4.73 | 502 | -12.8% | -9.4% |
| 16. East Flatbush, Remsen Village (67) | 4.77 | 775 | -9.9% | -13.8% |
| 17. Crown Heights north, Prospect Heights (77) | 4.88 | 494 | -8.9% | -11.2% |
| 18. Coney Island, Brighton Beach, Sea Gate (60) | 4.99 | 544 | +5.6% | +4.2% |
| 19. Bedford-Stuyvesant east (81) | 5.22 | 360 | +15.8% | -0.8% |
| 20. Bushwick (83) | 5.47 | 660 | +30.4% | +14.7% |
| 21. East New York, Cypress Hills, Starrett City (75) | 6.03 | 1,211 | -8.2% | -9.5% |
| 22. Brooklyn Heights, Downtown Brooklyn, DUMBO, Boerum Hill (84) | 6.34 | 416 | -18.6% | -18.5% |
| 23. Brownsville, Ocean Hill (73) | 8.49 | 836 | -11.6% | -13.6% |
Crimes from the NYPD CompStat weekly report for each precinct, January 1 to October 11 of 2026 and the same weeks of 2025, read October 17, 2026. Residents from the 2020 Census, counted by precinct. Rates are for the year so far, not a full year.
1.18 violent crimes per 1,000 residents. Bay Ridge sits in the far southwest corner of the borough, along the Narrows, with Shore Road Park and Owl’s Head Park on the water and the R train down Fourth Avenue. Dyker Heights, next door, is known for its holiday Christmas light displays and for Dyker Beach Park.
1.36 per 1,000. Inland from Bay Ridge, between Sunset Park and Midwood. The D train runs through its western side along New Utrecht Avenue, and the F train runs along McDonald Avenue on its eastern side, through Kensington.
1.83 per 1,000. South of Dyker Heights, running down to Gravesend Bay, with Bensonhurst Park on the water, served by the D and N trains.
1.87 per 1,000. Sheepshead Bay is built around its namesake bay, with fishing boats along Emmons Avenue. Manhattan Beach sits on the ocean to the south, and Madison lies just north. The B and Q trains stop at Sheepshead Bay and Kings Highway, and the Q at Avenue U.
2.17 per 1,000. Southeast Brooklyn, around Marine Park itself and its Salt Marsh Nature Center, with Jamaica Bay beyond. There is no subway stop inside the neighborhood; most people use buses, cars and the Belt Parkway.
2.18 per 1,000. Central Brooklyn, home to Brooklyn College and the shops of Kings Highway, with the Q train at Avenue H, Avenue J and Avenue M, and the B and Q at Kings Highway. This is where our office is, at 1524 East 23rd Street.
The seven major crimes fell from 24,395 to 22,657 compared with the same weeks last year. That is a drop of 7.1%, and it reached most of the safest areas and the rest alike: 19 precincts went down and 4 went up.
Brooklyn in 2026 so far, compared with the same weeks of 2025
Down 7.1%
All seven major crimes across Brooklyn, 24,395 to 22,657.
Shootings down 18.1%
204 shooting incidents became 167.
Midwood down 24.1%
The 70th Precinct, the biggest drop of all 23 precincts.
Bushwick up 14.7%
The 83rd Precinct, the biggest rise in the borough.
NYPD CompStat weekly precinct reports, January 1 to October 11 of each year.
The 70th Precinct covers Midwood, Ditmas Park, Fiske Terrace and Prospect Park South. Its seven major crimes fell from 1,124 to 853, down 24.1%. Violent crime there fell 33.2%, from 536 to 358. Both drops are the largest of any precinct.
Robbery is the biggest single reason. The 70th went from 152 robberies to 100, and felony assaults went from 359 to 239.
Bushwick’s 83rd Precinct rose 14.7%, from 1,300 to 1,491. Its violent crime rose 30.4%, the biggest increase of the 23. Canarsie’s violent crime also rose, up 27.6%, even though Canarsie still sits near the middle of the ranking.
Brownsville’s 73rd Precinct fell 13.6% this year, a real improvement. It still has the highest violent crime rate of the 23, 8.49 per 1,000 residents. Direction and level tell you different things, so the table shows both.
The six lowest rates are Bay Ridge, Borough Park, Bensonhurst, Sheepshead Bay with Madison, Marine Park, and Midwood. All six sit in the southern half of the borough, and all six are under the overall rate of 3.55. Several of them include big parks and tree-lined streets, though the numbers alone cannot say what drives low crime rates.
Picture the borough as a rough triangle. The lowest rates run along its southern half, in a band from the water at Bay Ridge to the marshes near Jamaica Bay.
One precinct needs a note. The 84th covers Brooklyn Heights, Boerum Hill and Downtown Brooklyn. Far more people work and shop there every day than live there, so a rate based on residents makes it look worse than it feels on its quiet side streets.
A precinct number is a starting point, not a verdict. The best neighborhoods for one person are not the best for another, and a safe place to live can still have a busy corner or a quiet block that feels different at night. Walk the block you are looking at on a weekday morning and again after dark, and look at the brownstones, the shops and the green space around it.
Inside our own area the numbers split in an honest way. Midwood’s 70th fell the most of any precinct. The 63rd, which covers Marine Park, went down 4.9% overall, but its violent crime rose 12.9%, from 217 to 245. Our Marine Park safety page breaks that down crime by crime.
Rank 5 of 23 for violent crime per resident. Overall crime down 4.9%, with violent crime up from 217 to 245.
Midwood’s 70th Precinct had the biggest drop in Brooklyn this year, down 24.1%.
Because “is it safe” is one of the first questions buyers ask, and most answers online are old forum threads or lists of places to live that never show their numbers. The top Google result for this search is still a Reddit thread from 2023.
The Behfar Team works out of 1524 East 23rd Street in Midwood. We sell in Midwood, Madison and Marine Park, and we know those blocks well. For the rest of Brooklyn we can show you the numbers and say plainly that it is not where we sell. If you own a home in one of our three neighborhoods, here is how we sell a Brooklyn house.
On this year’s NYPD numbers, Bay Ridge and Dyker Heights, in the 68th Precinct. It had 1.18 reported violent crimes per 1,000 residents from January 1 to October 11, the lowest rate of Brooklyn’s 23 precincts.
Crime is falling. Brooklyn’s seven major crimes are down 7.1% from the same weeks of 2025, and shootings are down 18.1%. The borough rate is 3.55 violent crimes per 1,000 residents so far this year, but it ranges from 1.18 to 8.49 depending on the precinct.
Midwood’s 70th Precinct ranks 6 of 23 for violent crime per resident, at 2.18 per 1,000. Its seven major crimes fell 24.1% this year, the biggest drop in Brooklyn.
Bay Ridge has the lowest violent crime rate in Brooklyn this year, 1.18 per 1,000 residents. Its seven major crimes went from 636 to 626 compared with the same weeks of 2025.
Canarsie’s 69th Precinct ranks 14 of 23, at 3.87 violent crimes per 1,000 residents. Its violent crime rose 27.6% this year, from 275 to 351.
Brownsville and Ocean Hill, in the 73rd Precinct, have the highest violent crime rate, 8.49 per 1,000 residents. East New York reports the most crime in total, 2,356 major crimes so far this year, because it is a large precinct.
From the police CompStat weekly report for each precinct, covering January 1 to October 11 of 2026, and from 2020 Census population counts by precinct. We read them on October 17, 2026.
Send us your address. We will tell you what homes near you have sold for this year and what that means for your price.
Crime figures are public NYPD numbers and are general information, not a safety guarantee or a prediction. Last reviewed October 2026.